It’s only expected that questions and gaps are faced by organizations of all kinds when managing their innovation portfolio. Visually mapping innovation projects opens the door to finding the right answers.
Mapping insights
In our previous article, we offered an overview of what implementing IPM (Innovation Portfolio Management) can do for you, why most companies should be using it, and how to lay down the foundation to begin working on it.
In this article, we’ll be taking a look at how IPM helps answer specific questions about company departments, but also about how innovation is addressed company-wide. IPM mapping is the key to accessing crucial information about your organization’s strategy.
Mapping 1: Strategic alignment
Is your focus balanced between project categories?
Are you focused on your strategic objectives — which ones are being prioritized?
Are there orphaned projects, and what does this mean?
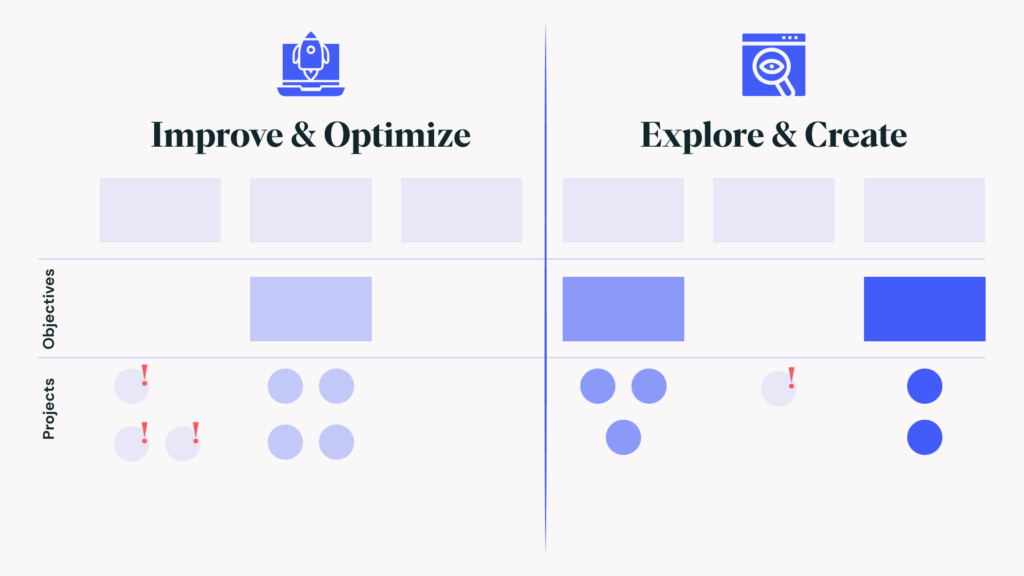
Regardless of how important it is, not all innovation projects are linked to a specific strategic objective. This first mapping helps address this initial challenge, grouping projects according to their strategic objectives.
Strategic alignment mapping offers a general understanding of which projects answer to which objectives, and those that don’t answer to any. Through this mapping, we can pinpoint orphaned projects that haven’t been linked to strategic objectives and refer to them as gray zones.
Mapping projects according to strategic priorities will also align company decision-making with these priorities, and will help you decide which projects need more attention, and which need to be reconsidered based on their focus areas.
It’s also important to highlight that this view offers visibility on topics that could (or should) be considered a company strategy, but haven’t been explicitly outlined as strategic priorities yet.
Putting it into practice
We teamed up with Four Paws and used this mapping as a cross-department exercise, to see which projects were being used to implement key strategic objectives. This mapping helped us discover that resource and focus re-allocation was needed.
The mapping let us see a couple of gray zones, and led the way to address the challenge — defining which strategic objectives orphaned projects were contributing to.
It also showed one of the main categories (Improve & Optimize) fostered most of the projects, while the other (Explore & Create) wasn’t very populated. The Four Paws team realized these projects were building the foundation for the company’s current strategy, this would enable them to meet their innovation goals for the future of the organization.
Mapping 2: Innovation ambition
Are you addressing innovation long term to meet your objectives?
Are our projects ambitious enough for the organization?
Are we allocating enough resources to be industry leaders or game-changers?
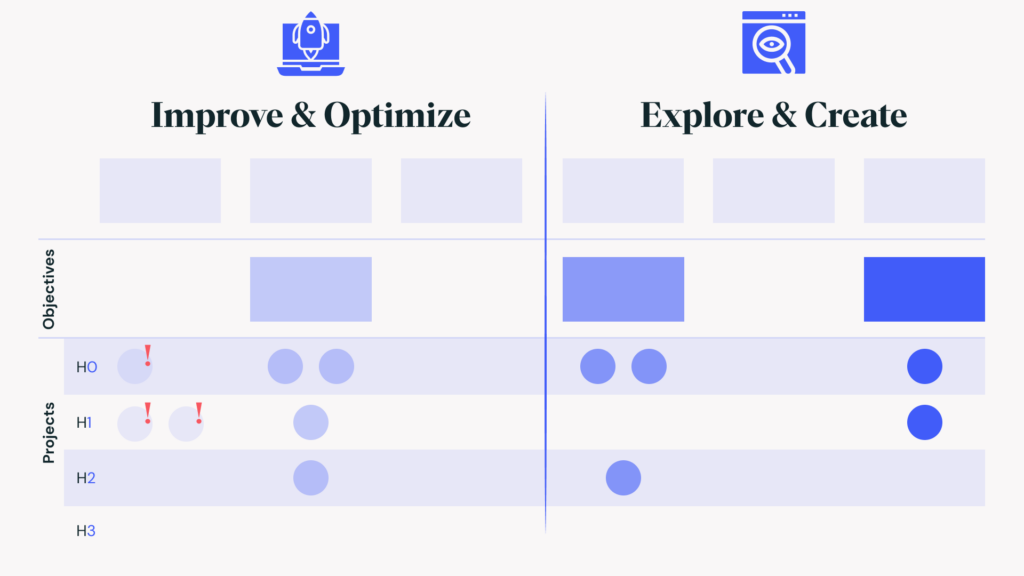
This mapping offers a more detailed view, meant to show how projects differ on ambition level according to innovation horizons, and it begins with having a practical scale from H0 to H3 to map them.
The blocks on the left of the image are the horizons. You’ll see the projects that were shown together in Mapping 1 are now separated across the horizons when we map innovation ambitions.
When taking a look at Mapping 2 and Mapping 1, you’ll see which projects accurately reflect company ambitions. For example, if being an industry leader is part of your organization’s goals, you will find out if your strategy for Horizons 2 and 3 match the projects actually being implemented.
Putting it into practice
Elements like type of industry, resource availability, and company size will be part of the innovation projects that can be pursued or explored in each horizon — this mapping is how you get these insights.
If you can see your projects are mainly focused on Horizon 1, your additional activities should be focused on the remaining horizons. Noticing this is a good starting point when you feel the volume of opportunities is paralyzing your growth, instead of boosting it.
For companies that are just beginning their innovation journey, it can be helpful to map Horizon 0 projects as well, which are the projects involving only minor incremental improvements.
Another way to put this mapping to good use is by using it for innovation exploration. This helps avoid taking on too many projects for the sake of it, focusing solely on the ones that drive your strategic priorities.
Mapping 3: Resource allocation
Which projects are taking up more resources?
Is your resource allocation well-balanced across your strategic priorities?
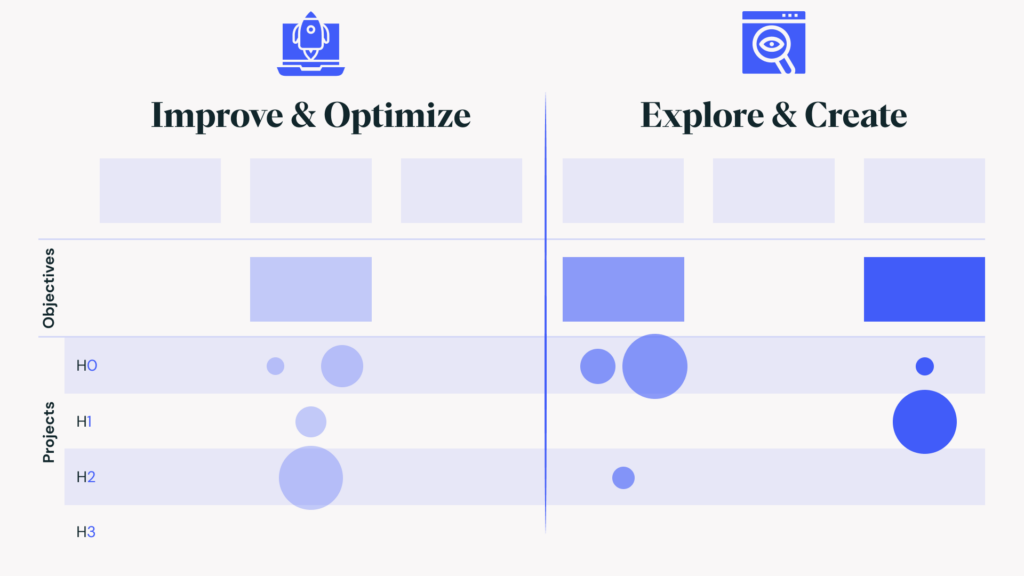
You’ll see that the circles representing each project vary in size, a project’s size on the mapping represents the amount of resources destined to it. But, despite its name, Mapping 3 does more than offer resource allocation insights, it also highlights inconsistencies across projects, departments, and ambition levels.
Take a look at each project’s Horizon and size. If you see very ambitious projects in Horizons 2 and 3, but that are very small in size; or closer Horizons with big projects mapped in them, these are bound to fail — a project’s size should always reflect its projected ambition.
Another outcome of this kind of mapping is visually accessing information about what drives higher resource allocation. This will help you understand how your innovation projects are being scoped in the first place.
Putting it into practice
During our collaboration with Four Paws, we noted some projects were being taken into account as medium sized ones. After mapping them, we realized these required much larger resources than the initial scope suggested. Thanks to this mapping, course correction was possible before projects had begun.
Mapping resource allocation shows how laying projects next to each other to compare how resources are shared is a visual aid to scope any project in your pipeline, and implement changes when the strategy calls for it.
Mapping 4: Identifying blockers
Are there projects not progressing fast enough or blocked?
Do you have duplicated projects or work efforts across different departments?
Are you spending too much time on a project with a set ambition?
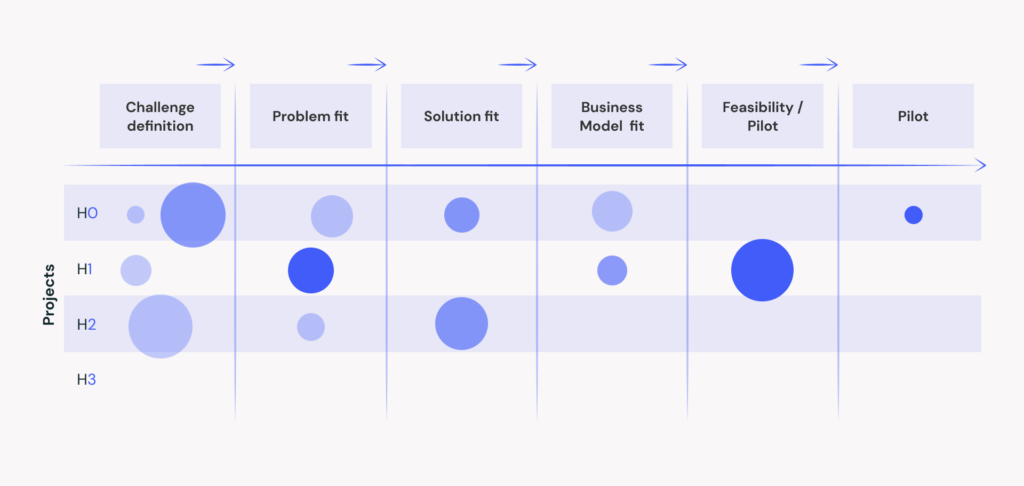
Having already uncovered most insights based on objectives and resources, now it’s time to look into a funnel view to understand how these projects are progressing. From an IPM manager perspective, this is one of the most insightful available mappings.
Take a look at the image. Knowing Horizon 1 projects should move faster than Horizon 3 ones, you’ll see which projects call for an accelerator or sprint, so they can be taken to the stage they belong in.
Identifying what’s blocking a project from being where it belongs also gives you access to tactical insights, allowing you to track their progress over time, and making this one of the few mappings to which you can add value as time goes by, for example when starting to validate the viability/business model of a project.
Protip: There will be overlaps with the mappings shared previously, but this view allows tracking projects across different departments at the same time — synergies will not go unnoticed.
Putting it into practice
When applying Mapping 4, we addressed with more clarity the issues regarding the speed of the projects in the different Horizons, uncovering the structural barriers causing it. At the same time, comparing projects in different departments helped indicate differences in process, ambition, and resources that resulted in cross-departmental learnings.
A thought that may come to you after learning about the different ways to visually map your innovation projects might be which one to get started with. Although there is no right answer, here’s how we would do it:
Think back to all the questions mentioned at the beginning of each type of mapping. These are some relevant doubts each specific mapping can help you clear, letting you know which mapping is more convenient. However, if it’s your first time implementing these views, we suggest doing all mappings to get a complete overview of your innovation portfolio.
For IPM to become a common practice, and for these insights to become part of how you make decisions, these mappings should be run periodically, remembering you’ll be gaining access to different information depending on the nature of each mapping, and based on your company’s needs.
Check out our other posts on innovation portfolio management

Make bigger moves
Align your current and future products with your growth ambitions. Structure your portfolio to win by making actionable choices with the right product mix. Set up an agile portfolio management system with simple and effective governance.